Building Order: Using Free Tools to Build a Simple App and Streamline Workflows
- Project Background
- Building Up: Creating the App
- Locking Down: A Bit of Security
- Adding On: Mapping Our Campus Buildings
- Dealing With Emergencies
Project Background
This wasn’t a project that was assigned, or one that grew out of any particularly pressing need. Instead, the idea was formed, and the application was built, over time by experimentation and the serendipitous coalescing of several different needs, wants and observations.
Since 2001, the website of the Weinberg Memorial Library of the University of Scranton has contained a section of pages about the buildings on our campus. The pages were originally built by students in a first year Research and Writing course—a great idea!
However, when we were preparing for the Library’s 20th anniversary celebration in 2012, we discovered the web page about the Library building indicated that the donors’ names were “not known.” Yikes! The donors’ names are included in the full name of the library, so the claim that we didn’t know the donors’ names looked ridiculous, not to mention insulting to the people who had given us millions of dollars to build the library. We had no idea how long the information had been missing from the page—probably years.
I began to look around at the other campus buildings pages and found woefully out of date (and sometimes completely inaccurate) information. I discovered that a few people had submitted updates to our Special Collections department, and a very well-intentioned staff member was keeping a record of this updated information. However, it was being kept on hand-annotated printouts of the original web pages that rarely saw the light of day and never made their way to the Systems department. Two staff members in Library Systems are the only people in the library who can make changes to the web pages, so no updates were ever made and the pages languished in basically the same state in which they originated, back in 2001.
In short, there was no efficient workflow for updating these pages, so they sat until updating them became “an emergency.”
I duly made the update and added the donors’ names—crisis averted, for now. But how could we address the other problems with the pages? And how could we turn them into something to be proud of? Our digital collections now contain many articles and photos about these buildings. Wouldn’t it be great to come up with a way to integrate those articles and photos as supplementary information, to be able to add information quickly and easily as we discover it, to make an interactive map of our campus, past and present—and to allow anyone to help out?
Right around the same time, my colleague Kristen described a pilot program that she had in mind for a huge collection scrapbooks containing newspaper clippings about the University’s history. These scrapbooks are a goldmine of University history information, but the 97 large-format scrapbooks contain over 16,000 separate articles.
The project involved so many steps and so much content that Kristen decided to go outside the Digital Services and Systems departments and encourage all library departments to help out. This was an inspiration for me in two ways: not only did I like the vision of a collaborative project among many library staff members, but on a more practical note it occurred to me that the people scanning and describing these newspaper articles from the scrapbooks would be coming across all sorts of informational tidbits about our campus buildings.
Wouldn’t it be great if we could capture that information at the moment they discover it—and even better, if they could update the web pages themselves, without needing any special training or access permissions?
I came across a JavaScript library that makes it very easy to use Google Spreadsheets as a lightweight CMS, and I ended up piecing together a small app that allows anyone working on the project to update the spreadsheet as soon as they discover new information, and to publish their change immediately (or nearly so) on the live website. Since we began using the app, we’ve had hundreds of updates to the pages, including live links to photos and articles in our digital collections. I was also easily able to extend the app by mapping the buildings’ locations.
There are so many great tools out there for free, and I’m grateful to their authors for giving their time and talents to projects that make life easier for the rest of us!
Building Up: Creating the App
This post outlines the creation of the campus buildings app using Google Spreadsheets, Tabletop.js, and Handlebars.js. I’ll try to explain everything clearly enough so that you can modify the process for your own projects.
This project was built for CONTENTdm, but if you’re running it on a regular webserver you’ll just need to add the Tabletop and Handlebars scripts to your HTML as you normally would, and jQuery as well if you want to use it (it is not required by Tabletop, although it is required to run some of the code I have below. Just an FYI if you’re mostly copying and pasting.).
Where we’re headed
This example shows how we can take data from a Google Spreadsheet that looks like this: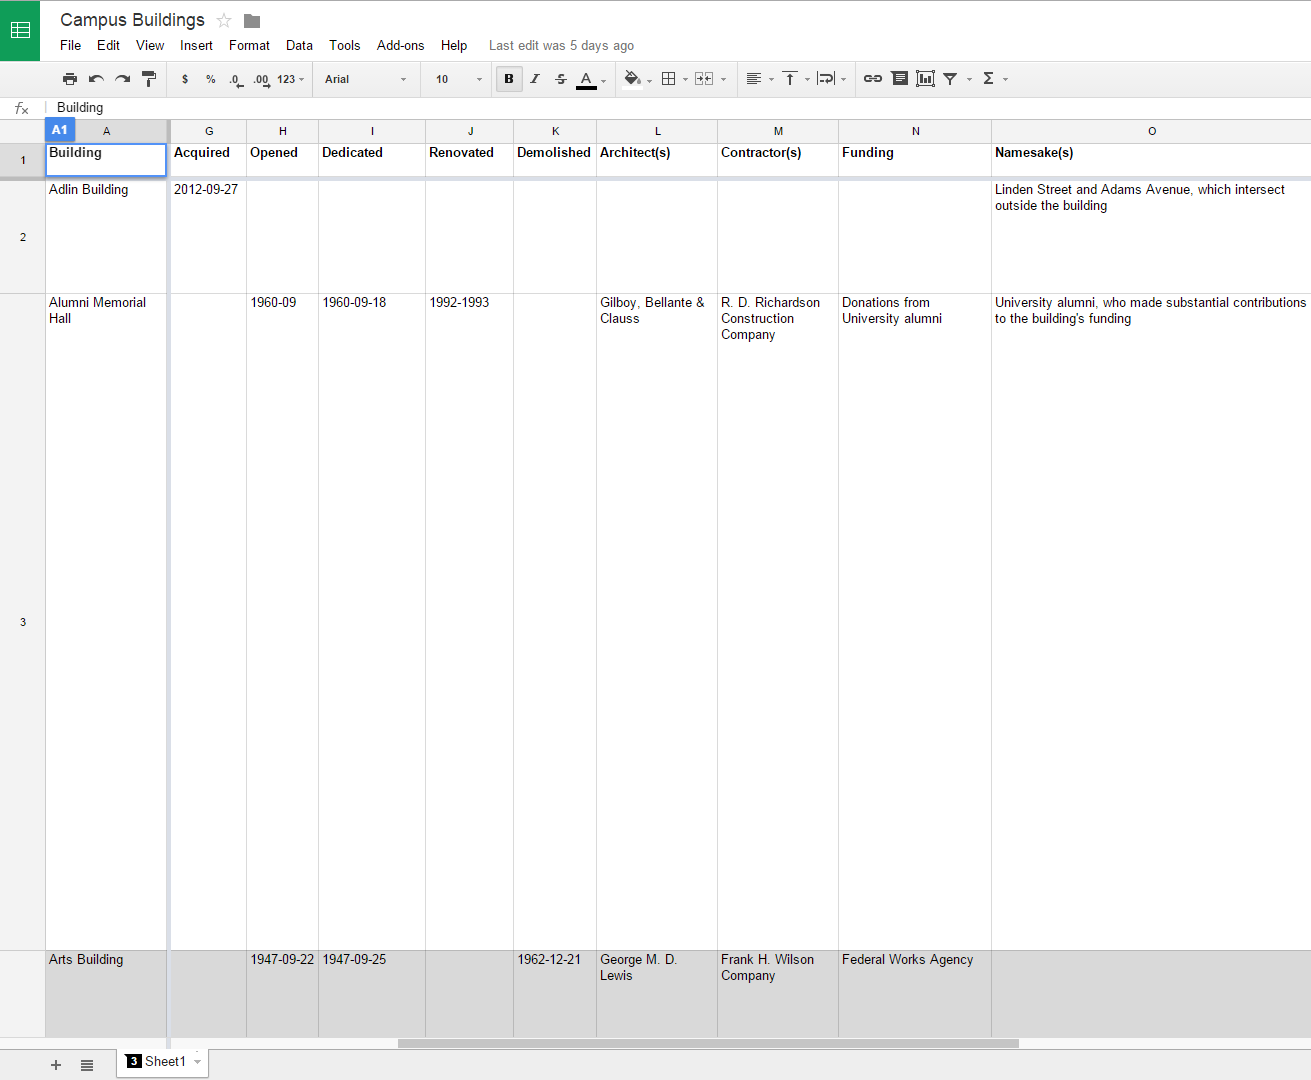
And dynamically generate a page of this form for each building on our campus:
Getting started
There are two basic components to this app:
- The Google Spreadsheet, where you’ll store and update your data
- The HTML file that generates and formats your output (in this case, a page for each building)
The raw materials
Spreadsheet
Here is an excerpt from our Google Spreadsheet. You can see how the columns correspond to the various data points that we want to appear on our building page. This is the only file that your staff and students will have to update in order to publish their information to the web!
- Go to Google Drive and create a new spreadsheet. In order to set up your columns, start by analyzing the data you think you’re going to want to collect. You can always add, remove or modify columns later, but it helps to have a basic idea when you start.
In our case, this step was pretty easy, because we had several earlier versions of campus buildings pages to guide us in the types of information we wanted to include.
- Then you’ll want to add some data—sample data is fine if you don’t have any real data to work with yet.
- Make sure you publish your spreadsheet to the web by going to File > Publish to the Web while you’re in your spreadsheet. This will ensure that your script (that you’re going to write next!) will be able to access your spreadsheet.
This is also where you will find your published spreadsheet’s URL; make note of this for later.
Script libraries
Now that your spreadsheet is set up, you’ll need to download two script libraries:
The Moving Parts
Next, we’re going to dig into the code just a bit. I’ll explain the three sections of the file that make this all work, and I’ll include screenshots that show how you will link up the necessary files in CONTENTdm. Then I’ll show my file in its entirety.
First, we need to include the code libraries that do the work for us.
These libraries are Tabletop.js and Handlebars.js, which you’ve downloaded already.
For my example, I’m going to assume that we’re using the CONTENTdm option that uses a consistent collection header and footer, and you just have to provide the “inside” of the page.
That means that we’ll have to include our scripts by going to the collection we want to use (or creating a new one), and navigating to Custom Pages/Scripts > Custom Scripts. There you want to add tabletop.js and handlebars.js. Be sure to save and publish.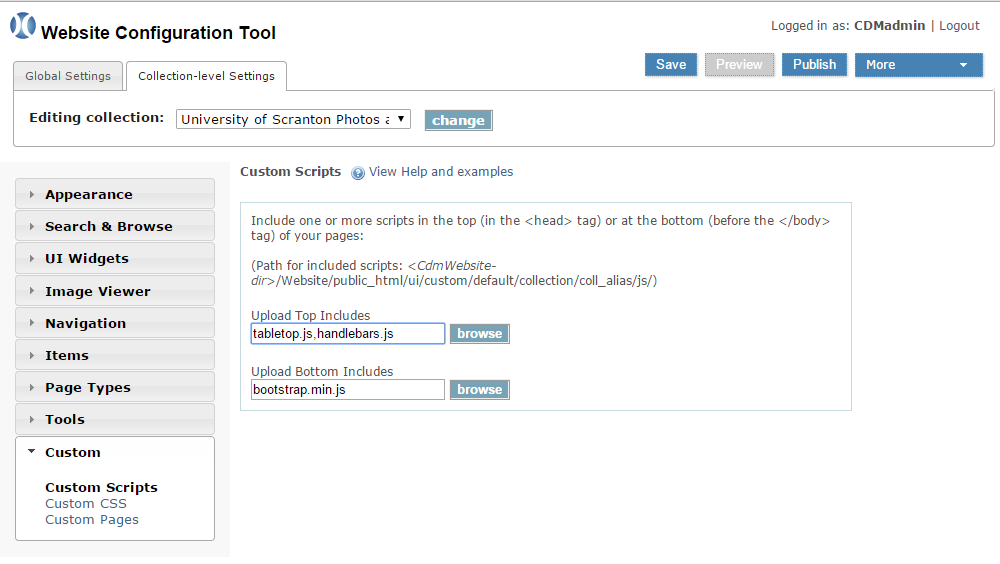
The first step is done!
Now, we’re going to create the custom page that will serve as our template. This page will contain both the template itself, and the script that pulls your data from your Google spreadsheet and sends it to the template.
The chunks of the file look like this: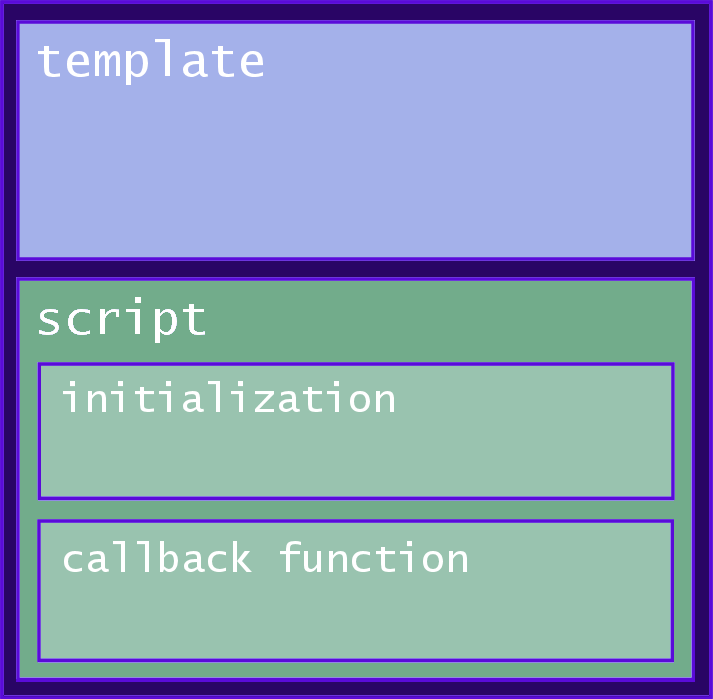
Let’s look first at the script.
The first part initializes Tabletop. That just means that you’re telling the script Tabletop how you want it to retrieve your data from your spreadsheet.
You can pretty much copy and paste the following into a blank text file:
<script type="text/javascript">

  var public_spreadsheet_url = 'https://docs.google.com/spreadsheets/d/1JZREv6TAFDh-use-your-own/pubhtml';

  $(document).ready (function() {
    Tabletop.init ({
      key: public_spreadsheet_url,
      callback: showInfo,
      debug: true,
      simpleSheet: true
  });

});
Just be sure to include your own spreadsheet key!
There are a number of options here, but all you really need are key and callback. The other options (and more!) are described in the Tabletop documentation: Tabletop Initialization.
Explaining callbacks is outside the scope of this documentation, but the basic callback for use with Tabletop and Handlebars looks like this:
<script type="text/javascript">
  function showInfo(data, tabletop) {
    var source = $("#building-template").html();
    var template = Handlebars.compile(source);
    $.each(tabletop.sheets("Sheet1").all(), function(i, building) {
      var html = template(building);
      $("#content").append(html);
    });
  }
</script>
This will pull in all of your data and display each row as one instance of the template—all on one page. That could be useful for something like a staff directory.
For our app, we want each building to have its own page. So I’ve modified my function a little bit so that I’m selecting only one row of the spreadsheet and outputting that data on its own page:
<script type="text/javascript">

  function showInfo(data, tabletop) {
    var rowKey = <?php echo $page?>;  // obtain building number from query string
    var source = $("#building-template").html();
    var template = Handlebars.compile(source);  // compile the template
    $("#content").html(template(data[rowKey])); // process and display the result
  }

</script>
The final part is to set up the template. This is where we can get creative and specify just how we want to format and display our data.
We’re using Handlebars templates. The template is just basic HTML interspersed with Handlebars expressions, which are simply your spreadsheet column names enclosed in curly brackets, like this: {}.
So, for example, if you want to display the name of your building as a level 1 heading, and then your dates of opening, dedication, and renovation in a table, your template might look like this:
<script id="building-template" type="text/x-handlebars-template">
  <h1>{{building}}</h1>
  <h2>Important Dates:</h2>
  <table>
    <tr>
      <td>Opening Date:</td>
      <td>{{opened}}</td>
    </tr>
    <tr>
      <td>Dedication Date:</td>
      <td>{{dedicated}}</td>
    </tr>
    <tr>
      <td>Renovation Date:</td>
      <td>{{renovated}}</td>
    </tr>
  </table>
</script>
See the field names from our spreadsheet enclosed in the double curly brackets? When the template is rendered, your script will simply substitute each value in the appropriate spot in the template.
As promised, here is my complete building template file (in use on our CONTENTdm server):
<?php
if (is_numeric($_GET['page']) && ($_GET['page']>=1 && $_GET['page']<=88)){
    $page = $_GET['page'] - 1; // obtain building number from query string and translate to spreadsheet row
}
else {
    header("Location: http://digitalservices.scranton.edu/cdm/universitybuildings/collection/p9000coll7/");
    exit;
}
?>

<script id="building-template" type="text/x-handlebars-template">
    <div class="span10" id="history">
        <h2 class="pagetitle">{{building}}</h2>
        <div class="row" id="buildingimages">
            <div class="span5">
                <img class="item bldimage <?php echo $page ?>" src="http://digitalservices.scranton.edu/ui/custom/default/collection/coll_p9000coll7/resources/custompages/universitybuildings/{{nowpicture}}" title="{{building}}">
                {{#if photographs}}<br><br><a href="{{photographs}}">View More Photos</a>{{/if}}</div>
            <div class="span5">
                <iframe class="smallmap" frameborder="0" scrolling="no" src="http://maps.google.com/maps?q=loc:{{coordinateshidden}}&num=1&vpsrc=0&hl=en&ie=UTF8&t=m&z=17&ll={{coordinateshidden}}&output=embed&iwloc="></iframe>
            </div>
        </div>
        <div class="row" id="buildingdata">
            {{{openBuildingFactsTable}}} {{! Helper function to add opening table tag if necessary }}
                {{#if alternatenames}}
                <tr>
                    <td class="fieldlabel"><strong>Alternate Name(s):</td>
                    <td class="fieldvalue">{{alternatenames}}</td>
                </tr>
                {{/if}}
                {{#if namesakes}}
                <tr>
                    <td class="fieldlabel"><strong>Namesake(s):</strong></td>
                    <td class="fieldvalue">{{{namesakes}}}</td>
                </tr>
                {{/if}}
                {{#if architects}}
                <tr>
                    <td class="fieldlabel"><strong>Architect(s):</strong></td>
                    <td class="fieldvalue">{{architects}}</td>
                </tr>
                {{/if}}
                {{#if contractors}}
                <tr>
                    <td class="fieldlabel"><strong>Contractor(s):</strong></td>
                    <td class="fieldvalue">{{contractors}}</td>
                </tr>
                {{/if}}
                {{#if funding}}
                <tr>
                    <td class="fieldlabel"><strong>Funding Source(s):</strong></td>
                    <td class="fieldvalue">{{funding}}</td>
                </tr>
                {{/if}}
                {{#if size}}
                <tr>
                    <td class="fieldlabel"><strong>Size:</strong></td>
                    <td class="fieldvalue">{{size}}</td>
                </tr>
                {{/if}}
            {{{closeBuildingFactsTable}}} {{! Helper function to add closing table tag if necessary }}
            {{{showDateHeading}}} {{! Helper function to display Important Dates heading and opening table tag if necessary }}
                {{#if groundbreaking}}
                    <tr>
                        <td class="fieldlabel"><strong>Ground Breaking:</strong></td>
                        <td class="fieldvalue">{{groundbreaking}}</td>
                    </tr>
                {{/if}}
                {{#if completed}}
                    <tr>
                        <td class="fieldlabel"><strong>Completed:</strong></td>
                        <td class="fieldvalue">{{completed}}</td>
                    </tr>
                {{/if}}
                {{#if acquired}}
                    <tr>
                        <td class="fieldlabel"><strong>Acquired:</strong></td>
                        <td class="fieldvalue">{{acquired}}</td>
                    </tr>
                {{/if}}
                {{#if opened}}
                    <tr>
                        <td class="fieldlabel"><strong>Opened:</strong></td>
                        <td class="fieldvalue">{{opened}}</td>
                    </tr>
                {{/if}}
                {{#if dedicated}}
                    <tr>
                        <td class="fieldlabel"><strong>Dedicated:</strong></td>
                        <td class="fieldvalue">{{dedicated}}</td>
                    </tr>
                {{/if}}
                {{#if renovated}}
                    <tr>
                        <td class="fieldlabel"><strong>Renovated:</strong></td>
                        <td class="fieldvalue">{{renovated}}</td>
                    </tr>
                {{/if}}
                {{#if demolished}}
                    <tr>
                        <td class="fieldlabel"><strong>Demolished:</strong></td>
                        <td class="fieldvalue">{{demolished}}</td>
                    </tr>
                {{/if}}
            {{{closeDateTable}}} {{! Helper function to add closing table tag if necessary }}
        {{#if notes}}
            <h3>Notes</h3>
            {{{notes}}}
        {{/if}}
        {{#if sources}}
            <h3>Sources</h3>
            {{{sources}}}
        {{/if}}
        </div>  <!-- close .buildingdata -->
    </div>  <!-- close .span10 -->
</script>


<div class="container">
    <div class="row">
        <?php include 'ui/custom/default/collection/default/resources/custompages/universityhistory/historysidebar-expanded.php'; ?>
        <noscript>
            <?php include 'ui/custom/default/collection/coll_p9000coll7/resources/custompages/buildingcache/'.$page.'.php'; ?>
        </noscript>
        <div id="content"></div>
    </div>  <!-- close .row -->
</div>  <!-- close .container -->
<script type="text/javascript">

    var public_spreadsheet_url = 'https://docs.google.com/spreadsheets/d/1JZREv6TAFDh-my-key/pubhtml';
    $(document).ready (function() {
        Tabletop.init ({
            key: public_spreadsheet_url,
            callback: showInfo,
            debug: true,
            simpleSheet: true,
            prettyColumnNames: false,
            proxy: "https://s3.amazonaws.com/my-bucket-name"
         });
       function showInfo(data, tabletop) {
            var rowKey = <?php echo $page?>;  // obtain building number from query string
            var source = $("#building-template").html();
            var template = Handlebars.compile(source);        // compile the template
            $("#content").html(template(data[rowKey]));          // process and display the result
        }
    });
</script>
You’ll see a few items I didn’t mention—helper functions that add a bit of logic to your templates. The Handlebars docs will help you understand how to write these functions.
Advanced users may also want to precompile templates. Here’s a great tutorial to get you started: Precompiling Handlebars Templates
Get creative!
Give it a try with your sample spreadsheet and you’ll see how easy it is to make changes to your page. Before long, you’ll have come up with your own project ideas!
Locking Down: A Bit of Security
Addition of Flatware as a Proxy
You may have noticed a potential issue with our campus buildings app. If you have everything set up as outlined above, your changes will appear immediately on whatever page contains the template. This can be really good! Or … it can be really bad.
Anytime you have lots of people collaborating on a project, you may have increased productivity and a smoother workflow, but you also increase the chances for error. What if someone messes up the HTML (if you’re using it in certain columns) or accidentally deletes a column—or the entire sheet? What if Google Drive goes down, as it has in the past?
This is where a simple proxy called Flatware enters the picture. Flatware was written by the same author as Tabletop. You set up Flatware as a web app, then simply start the Flatware web app and pass it your spreadsheet’s key. You only need to do the setup once. Then, whenever you click the “sync spreadsheets” button, Flatware will grab your Google Spreadsheet data and cache it in your S3 bucket.
Setting up Flatware
This is a more advanced topic, but I promise if you follow the instructions provided by Flatware’s creator, Jonathan Soma, it will all make sense. For me, it was a great way to learn about cloud deployment.
As Jonathan Soma recommended, I have Flatware running on Heroku, a cloud application platform. You could also try DigitalOcean or OpenShift.
Integrating With Tabletop
When Flatware is all set up, simply add one line to your Tabletop initialization (use your own S3 bucket name!):
proxy: "https://s3.amazonaws.com/[your-bucket-name]"
so that the complete initialization function now looks something like this:
<script type="text/javascript">

  var public_spreadsheet_url = 'https://docs.google.com/spreadsheets/d/1JZREv6TAFDh-use-your-own/pubhtml';

  $(document).ready (function() {
    Tabletop.init ({
      key: public_spreadsheet_url,
      callback: showInfo,
      debug: true,
      simpleSheet: true,
      proxy: "https://s3.amazonaws.com/your-bucket-name"
  });

});
Now your template will pull your data from your S3 cached version of your spreadsheet, not directly from the spreadsheet itself. You don’t need to make any other changes to your code.
So now the process looks like this: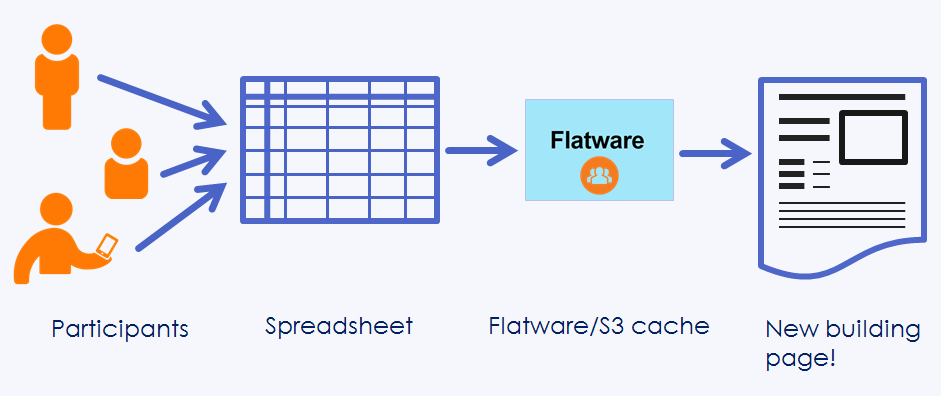
Simply run your Flatware instance (I keep a button on my browser’s Links bar for quick access), and sync your spreadsheet whenever you’re ready to push your changes to your live page.
This is a situation where you would need to decide what workflow is better for your situation. In a way, this returns us to the idea of a few gatekeepers for publishing content, but it makes it very easy to increase the privileges for anyone you trust: simply give them the Flatware link and they can immediately push their changes to the live website. It’s still much easier and quicker than getting credentials for web publishing in some institutions, or teaching web markup and editing to people who don’t wish to be developers.
Any other options?
What if you decide not to use Flatware but still want a safety net? You can use Google Spreadsheets’ revision history to save yourself, at least back to a certain point.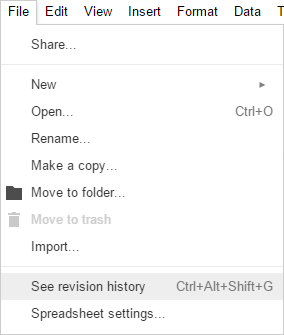
I also recommend maintaining a cache of static files, refreshed periodically, that you can revert to in an emergency. It’s fairly simple to write a web-scraping script in Python (using the Selenium and Beautiful Soup libraries) that will retrieve the rendered content of your pages and write it to files that you can then serve instead of your dynamic pages when you need to.
Adding On: Mapping Our Campus Buildings
I wanted to include a map as a visual index of our buildings’ locations, in addition to the standard text index.
Our first version of the campus buildings map was created using Google Fusion Tables. Fusion Tables provide a super-easy, out of the box way to create a quick map of just about anything that can be geocoded (or for which you have geographic coordinates).
The Fusion Table solution worked fine, but because there is no way to export automatically from a Google Spreadsheet (where our building data is stored) to a Fusion Table, I had to create the Fusion Table columns manually.
In our case, this isn’t as bad as it sounds, because:
- it isn’t very often that we need to add a new building, or change an existing building’s status to “Demolished”
- we don’t require all of the building data to be duplicated in the Fusion Table—just whatever basic details we need to populate the infowindow, and again, this information doesn’t change often.
But it’s inelegant, and never a good idea to have two data files to maintain if you can have only one.
Enter Mapsheet
Last week I came across Mapsheet.js, another great tool by Jonathan Soma, author of Tabletop.js and Flatware, both of which I used in the creation of the campus buildings app.
Mapsheet sounded like it would work almost as a swap-in replacement, with the advantage of being able to use our campus buildings Google Spreadsheet that stores all of our data!
It really was simple. All you really need are latitude and longitude columns in your spreadsheet to get some markers on your map. I also added url and iconurl columns to store the URL of each individual building page and the location of whatever custom icon I’d like to use for each marker.
Now, onto the page where all the magic happens!
Making Connections
First your includes:
<html>
    <body>
    <!-- Include Google Maps and Handlebars for templating, plus jQuery if you want it -->
      <script type="text/javascript" src="https://maps.googleapis.com/maps/api/js?sensor=false"></script>
      <script type="text/javascript" src="http://cdnjs.cloudflare.com/ajax/libs/handlebars.js/1.0.0/handlebars.min.js"></script>
      <script type="text/javascript" src="http://ajax.googleapis.com/ajax/libs/jquery/1.10.2/jquery.min.js"></script>

    <!-- Include Tabletop.js for accessing Google Spreadsheets and Mapsheet.js for mapping -->
      <script type="text/javascript" src="js/tabletop.js"></script>
      <script type="text/javascript" src="js/mapsheet.js"></script>

    <div id="Gmap"></div>

    <script id="popup-template" type="text/x-handlebars-template">
      {{#if image}}
        <img src="{{image}}" style='float: right; width: 75px; height: 50px; padding-left: 5px;'>
      {{/if}}
      <b>Name:</b> <a href="{{url}}">{{Building}}</a>
      {{#if Address}}
      <br><b>Address:</b> {{Address}}
      {{/if}}
    </script>

    <script type="text/javascript">

        $(document).ready( function() {
            var published_spreadsheet_url = 'https://docs.google.com/spreadsheets/d/1z89E2Ns8KKuEcY-use-your-own/pubhtml'; // use your own!

            // Get the infowindow template and compile it using Handlebars
            var source   = $("#popup-template").html();
            var template = Handlebars.compile(source);

            // Now let's make the map
            var map = Mapsheet({
              key: published_spreadsheet_url,
              element: "Gmap",
              mapOptions: {
                            center: [41.407875653600186, -75.65829877536014],
                            zoom: 16
                        },
              popupTemplate: template
            });

    </script>
    </body>
</html>
Note: If you’re building an app in CONTENTdm and working from my example, you have already included tabletop.js and handlebars.js among your Custom Scripts—so there’s no need to include them again. (And CONTENTdm already includes jQuery.) So you only need to download Mapsheet.js, and include it in the same way you included your other scripts.
Then, place this code where you want to display your map:
<html>
    <body>
    <!-- Include Google Maps and Handlebars for templating, plus jQuery if you want it -->
      <script type="text/javascript" src="https://maps.googleapis.com/maps/api/js?sensor=false"></script>
      <script type="text/javascript" src="http://cdnjs.cloudflare.com/ajax/libs/handlebars.js/1.0.0/handlebars.min.js"></script>
      <script type="text/javascript" src="http://ajax.googleapis.com/ajax/libs/jquery/1.10.2/jquery.min.js"></script>

    <!-- Include Tabletop.js for accessing Google Spreadsheets and Mapsheet.js for mapping -->
      <script type="text/javascript" src="js/tabletop.js"></script>
      <script type="text/javascript" src="js/mapsheet.js"></script>

    <div id="Gmap"></div>

    <script id="popup-template" type="text/x-handlebars-template">
      {{#if image}}
        <img src="{{image}}" style='float: right; width: 75px; height: 50px; padding-left: 5px;'>
      {{/if}}
      <b>Name:</b> <a href="{{url}}">{{Building}}</a>
      {{#if Address}}
      <br><b>Address:</b> {{Address}}
      {{/if}}
    </script>

    <script type="text/javascript">

        $(document).ready( function() {
            var published_spreadsheet_url = 'https://docs.google.com/spreadsheets/d/1z89E2Ns8KKuEcY-use-your-own/pubhtml'; // use your own!

            // Get the infowindow template and compile it using Handlebars
            var source   = $("#popup-template").html();
            var template = Handlebars.compile(source);

            // Now let's make the map
            var map = Mapsheet({
              key: published_spreadsheet_url,
              element: "Gmap",
              mapOptions: {
                            center: [41.407875653600186, -75.65829877536014],
                            zoom: 16
                        },
              popupTemplate: template
            });

    </script>
    </body>
</html>
Another Template
Next, we’re going to use Handlebars to create the template for our infowindow (the little box that pops up when you click a marker on the map). You can use basic HTML interspersed with Handlebars expressions (enclosed in curly brackets) that correspond to your column names.
<html>
    <body>
    <!-- Include Google Maps and Handlebars for templating, plus jQuery if you want it -->
      <script type="text/javascript" src="https://maps.googleapis.com/maps/api/js?sensor=false"></script>
      <script type="text/javascript" src="http://cdnjs.cloudflare.com/ajax/libs/handlebars.js/1.0.0/handlebars.min.js"></script>
      <script type="text/javascript" src="http://ajax.googleapis.com/ajax/libs/jquery/1.10.2/jquery.min.js"></script>

    <!-- Include Tabletop.js for accessing Google Spreadsheets and Mapsheet.js for mapping -->
      <script type="text/javascript" src="js/tabletop.js"></script>
      <script type="text/javascript" src="js/mapsheet.js"></script>

    <div id="Gmap"></div>

    <script id="popup-template" type="text/x-handlebars-template">
      {{#if image}}
        <img src="{{image}}" style='float: right; width: 75px; height: 50px; padding-left: 5px;'>
      {{/if}}
      <b>Name:</b> <a href="{{url}}">{{Building}}</a>
      {{#if Address}}
      <br><b>Address:</b> {{Address}}
      {{/if}}
    </script>

    <script type="text/javascript">

        $(document).ready( function() {
            var published_spreadsheet_url = 'https://docs.google.com/spreadsheets/d/1z89E2Ns8KKuEcY-use-your-own/pubhtml'; // use your own!

            // Get the infowindow template and compile it using Handlebars
            var source   = $("#popup-template").html();
            var template = Handlebars.compile(source);

            // Now let's make the map
            var map = Mapsheet({
              key: published_spreadsheet_url,
              element: "Gmap",
              mapOptions: {
                            center: [41.407875653600186, -75.65829877536014],
                            zoom: 16
                        },
              popupTemplate: template
            });

    </script>
    </body>
</html>
And finally, this function ties it all together:
<html>
    <body>
    <!-- Include Google Maps and Handlebars for templating, plus jQuery if you want it -->
      <script type="text/javascript" src="https://maps.googleapis.com/maps/api/js?sensor=false"></script>
      <script type="text/javascript" src="http://cdnjs.cloudflare.com/ajax/libs/handlebars.js/1.0.0/handlebars.min.js"></script>
      <script type="text/javascript" src="http://ajax.googleapis.com/ajax/libs/jquery/1.10.2/jquery.min.js"></script>

    <!-- Include Tabletop.js for accessing Google Spreadsheets and Mapsheet.js for mapping -->
      <script type="text/javascript" src="js/tabletop.js"></script>
      <script type="text/javascript" src="js/mapsheet.js"></script>

    <div id="Gmap"></div>

    <script id="popup-template" type="text/x-handlebars-template">
      {{#if image}}
        <img src="{{image}}" style='float: right; width: 75px; height: 50px; padding-left: 5px;'>
      {{/if}}
      <b>Name:</b> <a href="{{url}}">{{Building}}</a>
      {{#if Address}}
      <br><b>Address:</b> {{Address}}
      {{/if}}
    </script>

    <script type="text/javascript">

        $(document).ready( function() {
            var published_spreadsheet_url = 'https://docs.google.com/spreadsheets/d/1z89E2Ns8KKuEcY-use-your-own/pubhtml'; // use your own!

            // Get the infowindow template and compile it using Handlebars
            var source   = $("#popup-template").html();
            var template = Handlebars.compile(source);

            // Now let's make the map
            var map = Mapsheet({
              key: published_spreadsheet_url,
              element: "Gmap",
              mapOptions: {
                            center: [41.407875653600186, -75.65829877536014],
                            zoom: 16
                        },
              popupTemplate: template
            });

    </script>
    </body>
</html>
There are many more options for what you can do with Mapsheet, so be sure to check them out on GitHub.
The resulting simple but very powerful file looks like this:
<html>
    <body>
    <!-- Include Google Maps and Handlebars for templating, plus jQuery if you want it -->
      <script type="text/javascript" src="https://maps.googleapis.com/maps/api/js?sensor=false"></script>
      <script type="text/javascript" src="https://cdnjs.cloudflare.com/ajax/libs/handlebars.js/1.0.0/handlebars.min.js"></script>
      <script type="text/javascript" src="https://ajax.googleapis.com/ajax/libs/jquery/1.10.2/jquery.min.js"></script>

    <!-- Include Tabletop.js for accessing Google Spreadsheets and Mapsheet.js for mapping -->
      <script type="text/javascript" src="js/tabletop.js"></script>
      <script type="text/javascript" src="js/mapsheet.js"></script>

    <div id="Gmap"></div>

    <script id="popup-template" type="text/x-handlebars-template">
      {{#if image}}
        <img src="{{image}}" style='float: right; width: 75px; height: 50px; padding-left: 5px;'>
      {{/if}}
      <b>Name:</b> <a href="{{url}}">{{Building}}</a>
      {{#if Address}}
      <br><b>Address:</b> {{Address}}
      {{/if}}
    </script>

    <script type="text/javascript">

        $(document).ready( function() {
            var published_spreadsheet_url = 'https://docs.google.com/spreadsheets/d/1z89E2Ns8KKuEcY-use-your-own/pubhtml'; // use your own!

            // Get the infowindow template and compile it using Handlebars
            var source   = $("#popup-template").html();
            var template = Handlebars.compile(source);

            // Now let's make the map
            var map = Mapsheet({
              key: published_spreadsheet_url,
              element: "Gmap",
              mapOptions: {
                            center: [41.407875653600186, -75.65829877536014],
                            zoom: 16
                        },
              popupTemplate: template
            });

    </script>
    </body>
</html>
Again, if you’re using CONTENTdm to give you a standard header and footer and writing custom code for only the “insides” of your pages, you will probably only need the following lines:
<html>
    <body>
    <!-- Include Google Maps and Handlebars for templating, plus jQuery if you want it -->
      <script type="text/javascript" src="https://maps.googleapis.com/maps/api/js?sensor=false"></script>
      <script type="text/javascript" src="http://cdnjs.cloudflare.com/ajax/libs/handlebars.js/1.0.0/handlebars.min.js"></script>
      <script type="text/javascript" src="http://ajax.googleapis.com/ajax/libs/jquery/1.10.2/jquery.min.js"></script>

    <!-- Include Tabletop.js for accessing Google Spreadsheets and Mapsheet.js for mapping -->
      <script type="text/javascript" src="js/tabletop.js"></script>
      <script type="text/javascript" src="js/mapsheet.js"></script>

    <div id="Gmap"></div>

    <script id="popup-template" type="text/x-handlebars-template">
      {{#if image}}
        <img src="{{image}}" style='float: right; width: 75px; height: 50px; padding-left: 5px;'>
      {{/if}}
      <b>Name:</b> <a href="{{url}}">{{Building}}</a>
      {{#if Address}}
      <br><b>Address:</b> {{Address}}
      {{/if}}
    </script>

    <script type="text/javascript">

        $(document).ready( function() {
            var published_spreadsheet_url = 'https://docs.google.com/spreadsheets/d/1z89E2Ns8KKuEcY-use-your-own/pubhtml'; // use your own!

            // Get the infowindow template and compile it using Handlebars
            var source   = $("#popup-template").html();
            var template = Handlebars.compile(source);

            // Now let's make the map
            var map = Mapsheet({
              key: published_spreadsheet_url,
              element: "Gmap",
              mapOptions: {
                            center: [41.407875653600186, -75.65829877536014],
                            zoom: 16
                        },
              popupTemplate: template
            });

    </script>
    </body>
</html>
Déjà vu
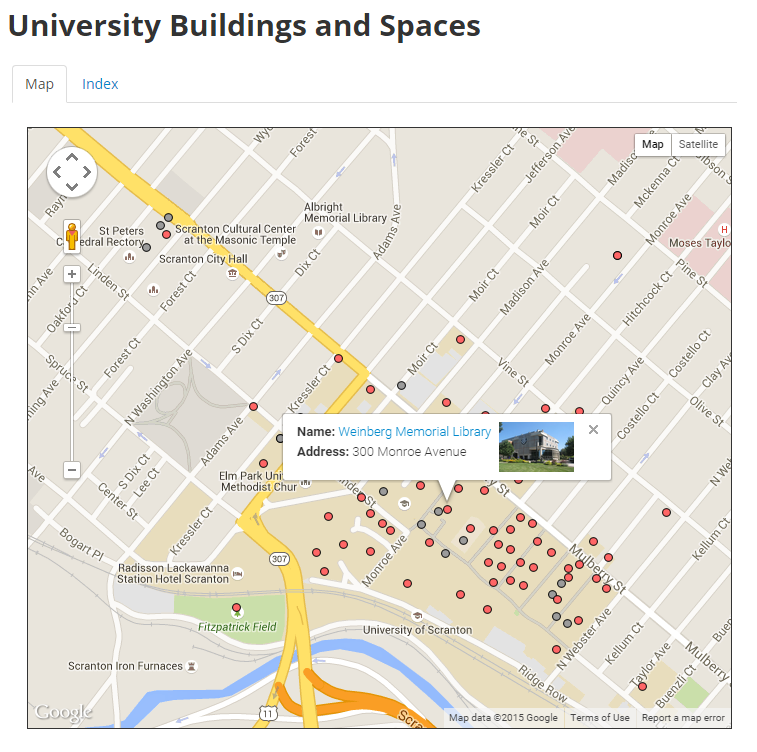
The new map looks eerily familiar, doesn’t it? I retained the old look for now because I wanted to focus on switching the “moving parts” from Fusion Tables to Mapsheet. It’s very simple to make style changes using CSS and functionality changes using all the options available in Mapsheet.
What’s next?
What else can be added onto such a system? What other applications can you think of?
My first thought is to set up a Google Form as the primary means of entering data, rather than having users enter data directly into the spreadsheet. With a form you can be more specific about the information you collect, and you can enforce data validation. You also get integrated analytics. Google Forms send their submitted responses to a Sheet anyway, so nothing else in the backend would have to change.
I can also see a system like this being used for:
- Project tracking
- Library consortia projects
- Inventory projects
- On-site/mobile data collection
Be aware that your institution’s policies may dictate that you can’t use Google apps for certain types of information. Otherwise, have fun!
Dealing With Emergencies
“Emergencies” may be a bit dramatic. After all, we’re not saving lives here, and if you mess up no one will lose an eye, and you’re not going to crash the global economy. Still, when you have a system that’s working great, everyone comes to rely on it. And when something breaks down, you’ll hear about it.
As I mentioned above, I recommend using Flatware as a proxy, and keeping a cache of static files (that you update periodically!) to switch to if your site goes down for any length of time. This also serves as another backup of content.
Stack Overflow is a great site for general help. Also try GitHub—open an issue for whatever project repository you’re using, and you will likely get help quickly.
You can also contact me! I’ll try to help in any way I can.