Creating Fusion Table Map of Campus Buildings
The final piece of the Campus Buildings application was building a simple map to display the locations of the buildings on campus. The simplest way to do this, given that we are already using a Google Spreadsheet to collect the data, was to set up a Google Fusion Table. Fusion Tables are still beta/experimental, but I’ve used them for a few small projects and they work well for data visualization, given how easy they are to set up.
The downside is that you can’t really create a Fusion Table map from a spreadsheet on the fly. So after my initial import, I simply import the spreadsheet whenever I get a notification that a new building has been added (or in the rare case that the fields I’m using have changed). For this project, this isn’t a burden because the only content that I display on the Fusion Table map is the building name, photo, address, and whether the building currently exists or has been destroyed. The notes, sources, and other fields that change frequently aren’t shown on the map. So after the initial map creation, I’ve only had to update the map two or three times. For a project where the map data changes frequently, especially when it’s being modified by other people, this would be more cumbersome.
Getting started
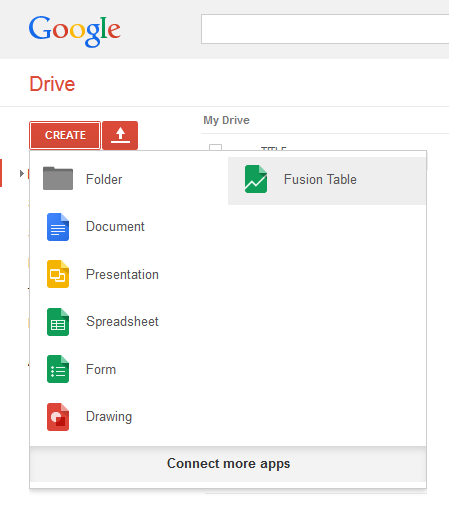
Initially, create a new Fusion Table from your spreadsheet.
In my case, I’m using just the building name, coordinates, address, building photo URL, and the icon type (which differentiates between current and destroyed buildings)—but you don’t have the option of importing only the columns you need. (It seems inefficient, but I haven’t found a way around this. I simply import all columns and only display the data I need via a custom infowindow).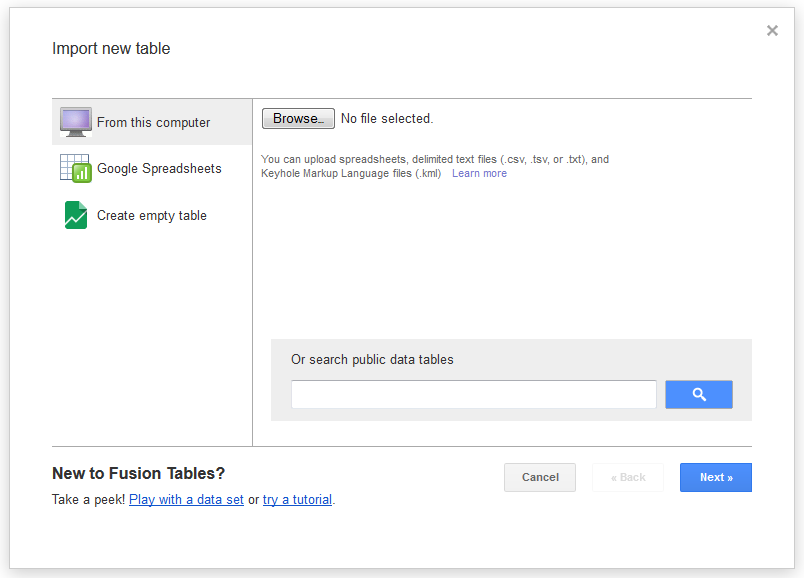
You can import a spreadsheet from another application like Excel, or simply choose a Google spreadsheet that you have already created.
Later on, when you want to update the Fusion Table with new data from your spreadsheet, delete all the rows of your Fusion Table (Edit → Delete all rows) and import them all again (File → Import more rows). This will not delete any data from your spreadsheet! It affects only the Fusion Table and it’s the easiest way I’ve found to deal with updating the data. The Fusion Table sheets themselves are very time-consuming to edit.
Creating the map
Once your data has been imported into the Fusion Table, you can create your map, assuming you have at least one column that can be geocoded. This can really be a column of any type of data that corresponds to location: geographic coordinates, addresses, even just names of states. Fusion Tables will choose one of your location columns and try to map it (you’ll see a tab labeled “Map of [your location column name]”). This may or may not result in what you want, but you can modify it.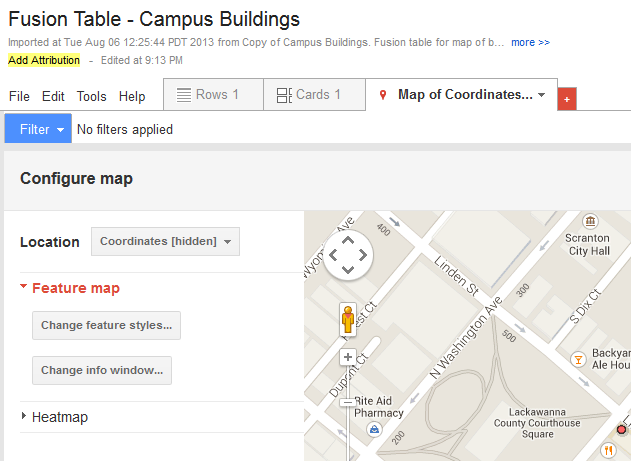
Choose the Map tab and change the Location column, if necessary. Then you can also change map feature styles and create a custom info window.
Map feature styles
For my project, the only map feature style I was concerned with was setting custom marker icons to differentiate between existing and former (demolished) buildings. Make sure your Fusion Table has a column for “icon type,” and then select “Use icon specified in a column” to indicate which column refers to the icon you want to use for each data point.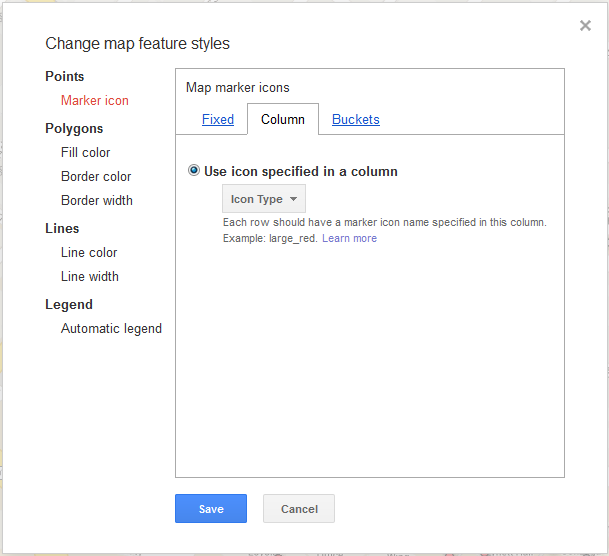
The default icons supplied with Fusion Tables are very limited. Use this documentation to find other icon styles that you can use with a column specifying the icon name: Fusion Tables Help: Change Placemark Icon.
Custom info windows
By using the Custom tab (or the checkboxes on the Automatic tab) in the info window modal box, we can easily show only the fields we need to. In this case, those fields are the building name (which will be a link to the building’s detail page), the street address, and a thumbnail image. Every building has a name and a detail page. However, not every building has a known street address or an image. How can we handle these cases?
The cool thing is that you can actually use dynamic templates (Closure Templates) for even more advanced customization. Adding a bit of conditional logic to exclude labels for empty cells (similar to Handlebars’ helper functions) is easy:
{template .contents}
<div class='googft-info-window' style='overflow-y: auto;'>
{if $data.value['Building Image URL']}
<img src="{$data.value['Building Image URL']}" style="float:right;">
{/if}
<b>Name:</b> <a href="{$data.value['Building Page URL']}">{$data.value.Building}</a><br>
{if $data.value['Address [hidden]']}
<b>Address:</b> {$data.value['Address [hidden]']}
{/if}
</div>
{/template}
The resulting map can be displayed in an iframe, or as a Google map Fusion Table layer, like so:
function initialize() {
    google.maps.visualRefresh = true;
    var map = new google.maps.Map(document.getElementById('googft-mapCanvas'), {
        center: new google.maps.LatLng(41.407875653600186, -75.65829877536014),
        zoom: 16,
        mapTypeId: google.maps.MapTypeId.ROADMAP
    });

    layer = new google.maps.FusionTablesLayer({
        map: map,
        heatmap: { enabled: false },
        query: {
            select: "col3",
            from: "10jtv2u5JV5yFHb584-q_RQ5sO0r5WbMCf1TD6jc",
            where: ""
        },
        options: {
            styleId: 2,
            templateId: 2
        }
    });
}

google.maps.event.addDomListener(window, 'load', initialize);
Then just use
<div id="googft-mapCanvas"></div>
to display the map wherever you want on your page.
Map display
The resulting map for the campus buildings app currently looks like this: